Golang Pprof 使用梳理
背景
当前碰到的问题:
- 部分服务 CPU 负载比较高
- 服务内存使用量比较大
- 服务高延迟(内存 CPU 负载都不高情况)
golang 开发中有一些定位这些问题的套路和工具,在本文中汇总,记录并不断改进解决问题的思路。
从两个方面考虑:
- 系统监控统计级别数据指标
- goroutine 数量
- 堆 (heap) 内存使用量
- 栈 (stack) 内存使用量
- 其他…(待补充)
- 问题定位所需的详细数据
- 获取系统实时堆内存分配详细信息:具体到这个内存在哪里分配的。
- 获取系统实时所有 goroutine 调用堆栈信息:具体到这个 goroutine 是在哪里启动的,以及当前在干什么
- 获取系统实时堆内存调优辅助统计信息: 具体是在哪里分配了多少内存,以及 TOP N 分别是哪些,甚至是每个内存分配的来源图
Diagnostics
获取系统实时堆内存分配详情
// 引入 pprof
import "net/http/pprof"
// 在 http router 上加入
this.debugMux.HandleFunc("/debug/pprof/", http.HandlerFunc(pprof.Index))
curl -XGET "http://192.168.149.150:8080/debug/pprof/heap?debug=2" 获取 heap 内存的详细信息,其中 8080 是你开启的 http server 的端口,debug=2 意味着需要输出详细信息
获取系统实时所有 goroutine 调用栈信息
通过curl -XGET "http://192.168.149.150:8080/debug/pprof/goroutine?debug=2"拿到的就是 goroutine 的详细信息
获取系统实时堆内存调优辅助统计信息
go tool pprof -inuse_space http://192.168.149.150:8080/debug/pprof/heap,进入 pprof 交互模式后,可以通过 top, tree 等进一步查看统计信息,同时,也可以通过 png 命令,将内存信息输出成图片,以图片的形式显示内存的分配、占用情况
获取 trace 数据
通过:curl -XGET "http://127.0.0.1:8080/debug/pprof/trace?seconds=30" -o 002_trace_2017_09_08.out我们将获取一个 30 秒的 trace 数据 (trace_02.out),通过go tool trace 002_trace_2017_09_08.out
也是各种坑, 比如页面打开空白: gotip tool trace xxx.out
Profile
侧重于统计程序各 goroutine 自身的运行状况,更加适用于分析针对 cpu 密集型逻辑导致的 latency 过高问题
cpu
heap
pprof 的 top 会列出 5 个统计数据:
- flat: 本函数占用的内存量
- flat%: 本函数内存占使用中内存总量的百分比
- sum%: 前面每一行 flat 百分比的和
- cum: 是累计量,假如 main 函数调用了函数 f, 函数 f 占用的内存量,也会记进来
- cum%: 是累计量占总量的百分比
Memory profiling records the stack trace when a heap allocation is made
Stack allocations are assumed to be free and are not tracked in the memory profile.
Memory profiling, like CPU profiling is sample based, by default memory profiling samples 1 in every 1000 allocations this rate can be changed.
Because of memory profiling is samples based and because it tracks allocation not use , using memory profiling to determine your Application’s overall memory usage is difficult .
Heap “不能” 定位内存泄漏

- 该 goroutine 只调用了少数几次,但是消耗大量的内存
- 该 goroutine 调用次数非常多,虽然协程调用过程中消耗的内存不多,但该调用路径上,协程数量巨大,造成大量的内存消耗,并且这些 goroutine 由于某种原因无法退出,占用的内存不会释放。
第二种情况, 就是goroutine 泄漏, 这是通过 heap 无法发现的,所以 heap 在定位内存泄漏这件事情上,发挥作用不大。
goroutine 泄漏怎么导致内存泄漏
- 每个 goroutine 占用 2kb 内存
- goroutine 执行过程中存在一些变量,如果这些变量指向堆中的内存,GC 会认为这些内存仍在使用,不会对其进行回收,这些内存无法使用,造成内存泄漏 a. goroutine 本身的栈占用的空间 b. goroutine 中的变量所占用的堆内存,这一部分是能通过 heap profile 体现出来的。
如何定位 goroutine 内存泄漏
pprof 查看当前 heap 里谁(哪一段代码分配)占用内存比较大, so 正确的做法是导出两个时间点的 heap profile 信息文件,使用 –base 参数进行对比
实战 Go 内存泄漏 通过监控工具和 go pprof 的 diff 方式来定位内存泄漏的问题,非常详细了,定位 goroutine 泄漏的方式
-
查看某条调用路径上,当前阻塞在此 goroutine 的数量
go tool pprof http://ip:port/debug/pprof/goroutine?debug=1
-
查看所有 goroutine 的运行栈,可以显示阻塞在此的时间
go tool pprof http://ip:port/debug/pprof/goroutine?debug=2
goroutine 究竟占了多少内存?, 先来看看结论
- goroutine 所占用的内存,均在栈中进行管理
- goroutine 所占用的栈空间的大小,由 runtime 按需进行分配
- 以 64 位环境的 JVM 为例,会默认固定为每个线程分配 1M 栈空间,如果大小分配不当,会出现栈溢出的问题
我是如何在大型代码库上使用pprof调查 Go 中的内存泄漏
- pprof的工作方式是使用画像。??? 画像是一组显示导致特定事件实例的调用顺序堆栈的追踪,例如内存分配.
- 如果内存消费是已个相关的考虑因素的话, 当数据不稀疏或者可以转换为顺序索引时,使用amp[int]T也没问题,但是通常应该使用切片实现。
- 扩容一个切片时,切片可能会使操作变慢,在map中这种变慢可以忽略不计。
Go 内存原理
然后来了解内存中的几个概念
分段栈
早起版本中,Go 给 goroutine 分配固定的 8kb 的内存区域,当 8kb 空间不够了怎么办?
GO 会在每个函数入口处插入一小段前置代码,它能够检查栈空间十分被消耗殆尽,如果用完了,会调用 morestack() 函数来扩展空间。
带来的问题: 熟知的 hot split problem (热点分裂问题)
连续栈
从 Go1.4 之后,正式使用连续机制,二倍大小空间进行复制
mem.Sys: Sys measures the virtual address space reserved by Go runtime for the heap, stacks, and other internal data structures.
mem.Alloc : 已经被分配并仍在使用的字节数, the same as mem.HeapAlloc
mem.TotalAlloc: 从开始运行到现在分配的内存总数
mem.HeapAlloc: 堆当前的用量, 具体如下两个
- all reachable objects
- unreachable objects that the garbage collector has not yet freed
mem.HeapSys: 包含堆当前和已经被释放但尚未归还操作系统的用量, 以及预留的空间.
mem.HeapIdle:
mem.HeapReleased:
以上详细解释参考 runtime#Memstats
pprofplus 将内存绘制成曲线图来查看内存的变化
golang 手动管理内存 #TODO 为什么加这个链接?
内存使用分析方法
理解 go 语言的内存使用 中三种方式
- 通过 runtime 包的 ReadMemStats 函数
- Memory Usage when reading large file 提问者读一定大小的文件到内存,而实际上分配的内存远高于文件大小。
- 通过 pprof 包, pprof 仅仅是获取了样本,而不是真正 的值,是非常重要的?
- tools/techniques for tracking down “too many open files” : the memory profile shows where the things ware created, not where they ‘live’.
- 通过 gc-trace 调式环境变量
- cgo 或者syscall 内存泄漏,怎么办?
- Also CGO / syscall (eg: malloc / mmap) memory is not tracked by go. How to analyze golang memory
- Go语言使用cgo时的内存管理笔记 如何定位cgo内存泄漏 #TODO
- Golang cgo memory
Go 语言设计与实现 详细从源码分析内存分配原理 #TODO
linux 内存结构
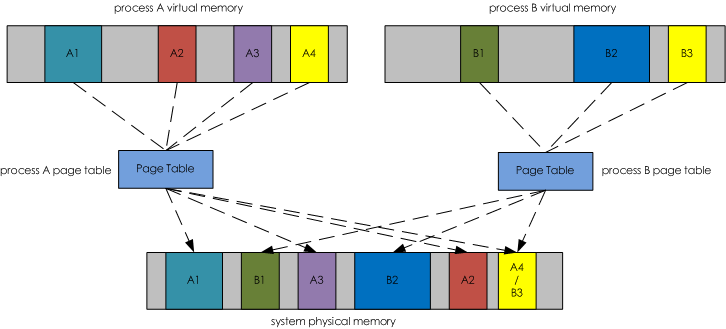
VIRT: 亦虚拟内存,虚拟地址空间大小,是程序映射并可以访问的内存数量, 参考下图对虚拟内存的解释,
RES: 亦常驻内存,进程虚拟空间中已经映射到物理内存的那部分的大小。
SHR: 亦共享内存,进程占用的共享内存大小,比如程序会依赖于很多外部的动态库(.so)。
mem: 物理内存
swap: 虚拟内存,即可以把数据存在在硬盘的数据
shared: 共享内存 , 存在物理内存中
buffers: 用于存放要输出到 disk 的数据的
cached: 存放从 disk 上读取的数据
点击查看图片, 来自 内存与 I/O 的交换, 详细讲解了 file-backed pages vs anonymous pages.
| 名称 | 说明 |
|---|---|
| total_mem | 物理内存总量 |
| used_mem | 已使用的物理内存量 |
| free_mem | 空闲的物理内存量 |
| shared_mem | 共享内存量 |
| buffer | buffer 所占的内存量,翻译为缓冲区缓存 |
| cache | cache 所占内存量,翻译为页面缓存 |
| real_used | 实际使用的内存量 |
| real_free | 实际空闲的内存量 |
| total_swap | swap 总量 |
| used_swap | 已使用的 swap |
| free-swap | 空闲的 swap |
real_used = used_mem - buffer - cache
real_free = free_mem + buffer + cache
total_mem = used_mem + free_mem
Linux cgroup - memory 子系统讲解, 非常全面的介绍的 cgroup 里的内存概念
这里面涉及到多个内存相关概念:
- tmpfs
- tmpfs 详解
- 临时文件系统,驻留在内存中
- tmpfs 大小: 只有真正在 tmpfs 存储数据了,才会去占用。
- page cache
- page: The virtual memory is divided in pages .
- Page cache 主要用来作为文件系统上的文件数据的缓存来用,尤其是针对当进程对文件有 read/write 操作的时候。什么是 page cache
- rss, 内存耗用:VSS/RSS/PSS/USS 的介绍
- anonymous and swap cache, not including tmpfs (shmem), in bytes
- anonymous cache
- 先了解匿名映射: 进程使用 malloc 申请内存,或使用 mmap(MAP_ANONYMOUS 的方式)申请的内存
- 再了解文件映射: 进行使用 mmap 映射文件系统的文件,包括普通文件,也包括临时文件系统 (tmpfs), 另外 Sys v 的 IPC 和 POSIX 的 IPC 也是。
- swap cache
- Swap 机制: 当内存不够的时候,我们可以选择性的将一块磁盘、分区或者一个文件当成交换空间,将内存上一些临时用不到的数据放到交换空间上,以释放内存资源给急用的进程。
- Inactive(anon 匿名映射), 这部分内存能被交换出去的。 需要注意的是,内核也将共享内存作为计数统计进了 Inactive(anon)中去了(是的,共享内存也可以被 Swap)。
active_file + inactive_file = cache - size of tmpfs

active_anon + inactive_anon = anonymous memory + file cache for tmpfs + swap cache
按照两个维度来划分内存
- whether memory is private ( specific to that process ) or shared
- private
- shared
- whether the memory is file-backed or not (in which case it is said the be anonymous )
- anonymous: purely in RAM
- file-backed: When a memory map is file-backed, the data is loaded from disk
见下表:
| PRIVATE | SHARED | |
|---|---|---|
| ANONYMOUS | stack, malloc(), mmap(ANON, PRIVATE), brk()/sbrk() |
mmap(ANON, SHARED) |
| FILE-BACKED | nmap(fd, PRIVATE) binary/shared libraries |
mmapn(fd, SHARED) |
采坑记 - go 服务内存暴涨 , 对 MADV_FREE 结合页表来分析,更加详细
内存分配
- 在 Linux 下,malloc 需要在其管理的内存不够用时,调用 brk 或 mmap 系统调用 ( syscall ) 找内核扩充其可用地址空间
- OS 用页表来管理进程的地址空间,其中记录了页的状态、对应的物理页地址等信息,一页通常是 4kb
- 当进程读 / 写尚未分配的页面时,会出发一个缺页中断 ( page fault ), 这时内核才会分配页面,在页表中标记为已分配,然后再恢复进程的执行。
内存回收
- 当 free 觉得有必要的时候,会调用 sbrk 或 munmap 缩小地址空间,这是针对一整段地址空间都空出来的情况
- 但更多的时候只释放其中一部分内容(比如连续的 ABCDE 五个页面中只释放 C 和 D), 并不需要(也不能)把地址空间缩小
- free 可以通过 madvise 告诉内存”这一段我不用了"
madvise
- 通过 madvise(addr, length, advise) 这个系统调用,告诉内核可以如何处理从 addr 开始的 length 字节。
- 在 Linux Kernel 4.5 之前, 只支持 MADV_DONTNEED,内核会在进程的页表中将页标记为"未分配”, 从而进程的 RSS 就会变小。
go 1.12 的改进
- 从 kernel 4.5 开始,Linux 支持了 MADV_FREE.
threadcreate
goroutine
block
mutex
实践 web 方式 Mutex profle
里面提到的 PPT 在本地分析不出数据,, 因为没有用 goroutine
for _, f := range factors(n) {
  mu.Lock()
  m[f]++
  mu.Unlock()
}
mu.Lock()
for _, f := range factors(n) {
  m[f]++
}
mu.Unlock()
Trace
Synchronization blocking profile
来自 rhys Hiltner 分析。
the thing that we are spending here is seconds that we’re spent waiting. we have kind of the goroutine name at the top of the stack.
关于方框中"of"前面的的 0, 表示 “zero time was spent inside of the box of 4.43. 来自 Profiling and Optimizing Go, 关于 Type:CPU 的图解,时间: 11:00
goroutines
goroutines that were running in that propram during those few seconds that i was recoording and listed.
根据 Execution time\Network wait time\Sync block time\Blocking syscall time\Sechedule wait time 的情况后,可以通过 graph 图了解 goroutine 详细情况。参考 [10]
Flame
pprof -http "localhost:12345" 'http://127.0.0.1:53668/block?id=19105152&raw=1'
查看 goroutine 中执行时间。
在参考 [7] 的视频 11:43 开始实际操作使用 Flame 定位程序执行慢的问题。
Debugging
Runtime statistics and events
实践
定位高延迟的服务。
使用 logrus 打印日志文件,其中 Logrus 使用全局锁导致,goroutine 之间竞争写锁。
func (entry *Entry) write() {
	entry.Logger.mu.Lock()
	defer entry.Logger.mu.Unlock()
	serialized, err := entry.Logger.Formatter.Format(entry)
	if err != nil {
		fmt.Fprintf(os.Stderr, "Failed to obtain reader, %v\n", err)
	} else {
		_, err = entry.Logger.Out.Write(serialized)
		if err != nil {
			fmt.Fprintf(os.Stderr, "Failed to write to log, %v\n", err)
		}
	}
}
在这篇 Is there a golang logging library around that doesn’t lock the calling goroutine for logging? 链接里也提到 logrus 写锁怎么处理
- 协程异步写日志,但是会占内存
- 换 zap 库
其实并没有解答为什么延迟非常高的问题。
TODO
docker cgroup 技术之 memory 看起来挺详细的分析文档,待细看。
Go语言使用cgo时的内存管理笔记, 简单教你如何定位cgo导致的内存泄漏
cgo内存分析 进阶版, 三部曲,英文.
Rakyll 一系列的调优
参考
-
go tool proof 郝琳的中文说明 #TODO https://github.com/hyper0x/go_command_tutorial/blob/master/0.12.md
-
Profiling Go Programs 官方 Blog #TODO https://blog.golang.org/pprof
-
一次 Golang 程序内存泄漏分析之旅 http://lday.me/2017/09/02/0012_a_memory_leak_detection_procedure/ 链接访问有点问题,可以用 google cache 查看文字
-
一次 Golang 程序延迟过大问题的定位过程 http://lday.me/2017/09/13/0013_a_latency_identification_procedure/
-
go tool trace https://making.pusher.com/go-tool-trace/ #TODO
-
Go 程序的性能监控与分析 pprof https://www.cnblogs.com/sunsky303/p/11058808.html
-
Rhys Hiltner - An Introduction to “go tool trace” https://www.youtube.com/watch?v=V74JnrGTwKA
-
关于 Go 程序调式、分析和优化 来自 Brad Fitzpatrick 的分享 #TODO https://studygolang.com/articles/4716
-
Golang remote profiling and flamegraphs, 对各种图阐述的比较清晰 https://matoski.com/article/golang-profiling-flamegraphs/
-
Using Go 1.10 new trace features to debug an integration test, 这边文章描述了 trace 使用过程,赞 https://medium.com/@cep21/using-go-1-10-new-trace-features-to-debug-an-integration-test-1dc39e4e812d
-
Profiling Go programs with pprof #TODO https://jvns.ca/blog/2017/09/24/profiling-go-with-pprof/
-
rakyll blog #TODO https://rakyll.org/archive/
-
Diagnostics 官文 #TODO https://golang.org/doc/diagnostics.html
-
实战 Go 内存泄漏 https://segmentfault.com/a/1190000019222661