Golang
- 1: About Golang String
- 2: Monorepo for Golang With Bazel
- 3: Golang Pprof 使用梳理
- 4: Gorm
- 5: Golang语言之禅
- 6: Code Review 开始
- 7: Gomonkey Test
- 8: Daily 0131 Golang 杂乱
1 - About Golang String
问题
package main

import (
	"fmt"
)
func main() {
	var bys  [20]byte

	bys[0] =  'h'
	bys[1] =  'e'
	bys[2] =  'i'

	if string(bys[:]) == "hei" {
		fmt.Println("[20]byte('h','e','i') === \"hei\"")
	}
}
输出: [20]byte(‘h’,‘e’,‘i’) === “hei”
要点
- the internal structure of any string type is declared like:
type _string struct {
   elements *byte // underlying bytes
   len      int   // number of bytes
}
-
String types are all comparable, When comparing two strings, their underlying bytes will be compared, one byte by one byte.
-
if one string is a prefix of the other one and the other one is longer, then the other one will viewed as the large one.
-
when a byte slice is converted to a string, the underlying byte sequence of the result string is also just a deep copy of the byte slice.
延伸
package main

import (
	"fmt"
)

const s = "Go101.org"

// len(s) is a constant expression,
// whereas len(s[:]) is not.
var a byte = 1 << len(s) / 128
var b byte = 1 << len(s[:]) / 128

func main() {
	fmt.Println(a, b) // 4 0
}
为什么会出现不一样的结果,一个要点是: the special type deduction rule in bitwise shift operator operation
-
当位运算左元素为 untyped value, 并且右元素为 constant 时,运算的结果类型保持与左元素一样。
-
当位运算左元素为 untyped value, 并且右元素为 non-constant 时,首先左元素类型转化为 assumed type (it would assume if the bitwise shift operator operation were replaced by its left operand alone)
根据上面两个 rule, 上面语句变成:
var a = byte(int(1) << len(s) / 128)
var b = byte(1) << len(s[:]) / 128
为什么会有这样的 rule ?
avoid the cases that some bitwise shift operations retuan different results on different architectures but the differences will not be detected in time.
举个例子
var m = uint(32)
// The following three lines are equivalent to each other.
var x int64 = 1 << m
var y = int64(1 << m)
var z = int64(1) << m
2 - Monorepo for Golang With Bazel
背景
ProtocolBuffer + gRPC + Bazel + Monorepo + Microservice is the common poly glot pattern which is also used in Google and other tech companies
微服务面临的问题是大量的 repo(成百上千), 尤其在依赖库的管理、规范的落地,非常麻烦困难。
需求点
- Avoid depending on the host system
- 使用相同的 Go distribition
- Try to stay reproducible and deterministic
- 使用同一的 go.mod 来管理依赖
- 在不同的应用里可以服用共同的代码块
- 可以执行单个应用的测试也可以执行所有应用的测试
- 可以构建单个应用或者所有的应用
- 构建时间短,可以复用已经构建好的 artifacts
新概念
Bazel
Bazel is an open-source build and test tool similar to Make, Maven, and Gradle. It uses a human-readable, high-level build language. Bazel supports projects in multiple languages and builds outputs for multiple platforms. Bazel supports large codebases across multiple repositories, and large numbers of users.
Rule
A rule defines a series of actions that Bazel performs on inputs to produce a set of outputs.
rule_go 为 golang 编写的 rules。
对 Rule 进一步的了解,学习如何编写 rule,资料入口:rule_go 的作者系列文档: A simple set of Go rules for Bazel, used for learning and experimentation.
repository rule
解决依赖于安装在本机上的 toolchain,这样如果不同的开发者需要在本地上安装 toolchain。 一旦 toolchain 不一样的时候,构建出来的结果不一样。于是,通过 repository rule 来下载 go toolchain 和生成 custom build file.
a repository rule, a special function that can be used in a WORKSPACE file to define an external WORKSPACE.
Gazelle
Gazelle is a build file generator for Bazel projects. It can create new BUILD.bazel files for a project that follows language conventions, and it can update existing build files to include new sources, dependencies, and options. Gazelle natively supports Go and protobuf,
实践
《Create Go Monorepo with Go-modules and Bazel》
Example: https://github.com/PxyUp/go_monorepo
给 go-present 仓库加上 bazel 构建 monorepo 仓库管理方式
Gazelle 使用
bazel run //:gazelle
疑惑点:
- 每个 module 需要写 BUILD.bazel 配置文件,带来额外的麻烦。
- Gazelle build file generator,原生支持 Go / protobuf
- 如何跟 reviewdog(golangci-linter) 结合
-
不支持 IDE, 给习惯用 IDE 的来说是不愿意的接受 - 如何处理 grpc 生成的代码
- 共享生成的仓库
结论
- 有利于代码共享,解决各自孤立的状态
- 有利于统一依赖库,统一升级,确保安全。
- 新的技术,激活技术氛围和兴趣
FAQ
Q: how do you set up a CI/CD pipeline for a mono repo? When a code change to the repository triggers CI
A: http://blog.shippable.com/ci/cd-of-microservices-using-mono-repos, 更多内容参考: https://github.com/korfuri/awesome-monorepo/blob/master/README.md
参考
Guide: Create monorepo with Go Modules and Bazel
Monorepo with bazel and go module: 践行者
3 - Golang Pprof 使用梳理
背景
当前碰到的问题:
- 部分服务 CPU 负载比较高
- 服务内存使用量比较大
- 服务高延迟(内存 CPU 负载都不高情况)
golang 开发中有一些定位这些问题的套路和工具,在本文中汇总,记录并不断改进解决问题的思路。
从两个方面考虑:
- 系统监控统计级别数据指标
- goroutine 数量
- 堆 (heap) 内存使用量
- 栈 (stack) 内存使用量
- 其他…(待补充)
- 问题定位所需的详细数据
- 获取系统实时堆内存分配详细信息:具体到这个内存在哪里分配的。
- 获取系统实时所有 goroutine 调用堆栈信息:具体到这个 goroutine 是在哪里启动的,以及当前在干什么
- 获取系统实时堆内存调优辅助统计信息: 具体是在哪里分配了多少内存,以及 TOP N 分别是哪些,甚至是每个内存分配的来源图
Diagnostics
获取系统实时堆内存分配详情
// 引入 pprof
import "net/http/pprof"
// 在 http router 上加入
this.debugMux.HandleFunc("/debug/pprof/", http.HandlerFunc(pprof.Index))
curl -XGET "http://192.168.149.150:8080/debug/pprof/heap?debug=2" 获取 heap 内存的详细信息,其中 8080 是你开启的 http server 的端口,debug=2 意味着需要输出详细信息
获取系统实时所有 goroutine 调用栈信息
通过curl -XGET "http://192.168.149.150:8080/debug/pprof/goroutine?debug=2"拿到的就是 goroutine 的详细信息
获取系统实时堆内存调优辅助统计信息
go tool pprof -inuse_space http://192.168.149.150:8080/debug/pprof/heap,进入 pprof 交互模式后,可以通过 top, tree 等进一步查看统计信息,同时,也可以通过 png 命令,将内存信息输出成图片,以图片的形式显示内存的分配、占用情况
获取 trace 数据
通过:curl -XGET "http://127.0.0.1:8080/debug/pprof/trace?seconds=30" -o 002_trace_2017_09_08.out我们将获取一个 30 秒的 trace 数据 (trace_02.out),通过go tool trace 002_trace_2017_09_08.out
也是各种坑, 比如页面打开空白: gotip tool trace xxx.out
Profile
侧重于统计程序各 goroutine 自身的运行状况,更加适用于分析针对 cpu 密集型逻辑导致的 latency 过高问题
cpu
heap
pprof 的 top 会列出 5 个统计数据:
- flat: 本函数占用的内存量
- flat%: 本函数内存占使用中内存总量的百分比
- sum%: 前面每一行 flat 百分比的和
- cum: 是累计量,假如 main 函数调用了函数 f, 函数 f 占用的内存量,也会记进来
- cum%: 是累计量占总量的百分比
Memory profiling records the stack trace when a heap allocation is made
Stack allocations are assumed to be free and are not tracked in the memory profile.
Memory profiling, like CPU profiling is sample based, by default memory profiling samples 1 in every 1000 allocations this rate can be changed.
Because of memory profiling is samples based and because it tracks allocation not use , using memory profiling to determine your Application’s overall memory usage is difficult .
Heap “不能” 定位内存泄漏

- 该 goroutine 只调用了少数几次,但是消耗大量的内存
- 该 goroutine 调用次数非常多,虽然协程调用过程中消耗的内存不多,但该调用路径上,协程数量巨大,造成大量的内存消耗,并且这些 goroutine 由于某种原因无法退出,占用的内存不会释放。
第二种情况, 就是goroutine 泄漏, 这是通过 heap 无法发现的,所以 heap 在定位内存泄漏这件事情上,发挥作用不大。
goroutine 泄漏怎么导致内存泄漏
- 每个 goroutine 占用 2kb 内存
- goroutine 执行过程中存在一些变量,如果这些变量指向堆中的内存,GC 会认为这些内存仍在使用,不会对其进行回收,这些内存无法使用,造成内存泄漏 a. goroutine 本身的栈占用的空间 b. goroutine 中的变量所占用的堆内存,这一部分是能通过 heap profile 体现出来的。
如何定位 goroutine 内存泄漏
pprof 查看当前 heap 里谁(哪一段代码分配)占用内存比较大, so 正确的做法是导出两个时间点的 heap profile 信息文件,使用 –base 参数进行对比
实战 Go 内存泄漏 通过监控工具和 go pprof 的 diff 方式来定位内存泄漏的问题,非常详细了,定位 goroutine 泄漏的方式
-
查看某条调用路径上,当前阻塞在此 goroutine 的数量
go tool pprof http://ip:port/debug/pprof/goroutine?debug=1
-
查看所有 goroutine 的运行栈,可以显示阻塞在此的时间
go tool pprof http://ip:port/debug/pprof/goroutine?debug=2
goroutine 究竟占了多少内存?, 先来看看结论
- goroutine 所占用的内存,均在栈中进行管理
- goroutine 所占用的栈空间的大小,由 runtime 按需进行分配
- 以 64 位环境的 JVM 为例,会默认固定为每个线程分配 1M 栈空间,如果大小分配不当,会出现栈溢出的问题
我是如何在大型代码库上使用pprof调查 Go 中的内存泄漏
- pprof的工作方式是使用画像。??? 画像是一组显示导致特定事件实例的调用顺序堆栈的追踪,例如内存分配.
- 如果内存消费是已个相关的考虑因素的话, 当数据不稀疏或者可以转换为顺序索引时,使用amp[int]T也没问题,但是通常应该使用切片实现。
- 扩容一个切片时,切片可能会使操作变慢,在map中这种变慢可以忽略不计。
Go 内存原理
然后来了解内存中的几个概念
分段栈
早起版本中,Go 给 goroutine 分配固定的 8kb 的内存区域,当 8kb 空间不够了怎么办?
GO 会在每个函数入口处插入一小段前置代码,它能够检查栈空间十分被消耗殆尽,如果用完了,会调用 morestack() 函数来扩展空间。
带来的问题: 熟知的 hot split problem (热点分裂问题)
连续栈
从 Go1.4 之后,正式使用连续机制,二倍大小空间进行复制
mem.Sys: Sys measures the virtual address space reserved by Go runtime for the heap, stacks, and other internal data structures.
mem.Alloc : 已经被分配并仍在使用的字节数, the same as mem.HeapAlloc
mem.TotalAlloc: 从开始运行到现在分配的内存总数
mem.HeapAlloc: 堆当前的用量, 具体如下两个
- all reachable objects
- unreachable objects that the garbage collector has not yet freed
mem.HeapSys: 包含堆当前和已经被释放但尚未归还操作系统的用量, 以及预留的空间.
mem.HeapIdle:
mem.HeapReleased:
以上详细解释参考 runtime#Memstats
pprofplus 将内存绘制成曲线图来查看内存的变化
golang 手动管理内存 #TODO 为什么加这个链接?
内存使用分析方法
理解 go 语言的内存使用 中三种方式
- 通过 runtime 包的 ReadMemStats 函数
- Memory Usage when reading large file 提问者读一定大小的文件到内存,而实际上分配的内存远高于文件大小。
- 通过 pprof 包, pprof 仅仅是获取了样本,而不是真正 的值,是非常重要的?
- tools/techniques for tracking down “too many open files” : the memory profile shows where the things ware created, not where they ‘live’.
- 通过 gc-trace 调式环境变量
- cgo 或者syscall 内存泄漏,怎么办?
- Also CGO / syscall (eg: malloc / mmap) memory is not tracked by go. How to analyze golang memory
- Go语言使用cgo时的内存管理笔记 如何定位cgo内存泄漏 #TODO
- Golang cgo memory
Go 语言设计与实现 详细从源码分析内存分配原理 #TODO
linux 内存结构
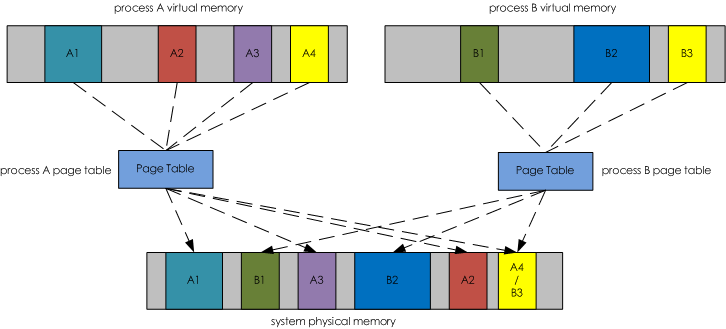
VIRT: 亦虚拟内存,虚拟地址空间大小,是程序映射并可以访问的内存数量, 参考下图对虚拟内存的解释,
RES: 亦常驻内存,进程虚拟空间中已经映射到物理内存的那部分的大小。
SHR: 亦共享内存,进程占用的共享内存大小,比如程序会依赖于很多外部的动态库(.so)。
mem: 物理内存
swap: 虚拟内存,即可以把数据存在在硬盘的数据
shared: 共享内存 , 存在物理内存中
buffers: 用于存放要输出到 disk 的数据的
cached: 存放从 disk 上读取的数据
点击查看图片, 来自 内存与 I/O 的交换, 详细讲解了 file-backed pages vs anonymous pages.
| 名称 | 说明 |
|---|---|
| total_mem | 物理内存总量 |
| used_mem | 已使用的物理内存量 |
| free_mem | 空闲的物理内存量 |
| shared_mem | 共享内存量 |
| buffer | buffer 所占的内存量,翻译为缓冲区缓存 |
| cache | cache 所占内存量,翻译为页面缓存 |
| real_used | 实际使用的内存量 |
| real_free | 实际空闲的内存量 |
| total_swap | swap 总量 |
| used_swap | 已使用的 swap |
| free-swap | 空闲的 swap |
real_used = used_mem - buffer - cache
real_free = free_mem + buffer + cache
total_mem = used_mem + free_mem
Linux cgroup - memory 子系统讲解, 非常全面的介绍的 cgroup 里的内存概念
这里面涉及到多个内存相关概念:
- tmpfs
- tmpfs 详解
- 临时文件系统,驻留在内存中
- tmpfs 大小: 只有真正在 tmpfs 存储数据了,才会去占用。
- page cache
- page: The virtual memory is divided in pages .
- Page cache 主要用来作为文件系统上的文件数据的缓存来用,尤其是针对当进程对文件有 read/write 操作的时候。什么是 page cache
- rss, 内存耗用:VSS/RSS/PSS/USS 的介绍
- anonymous and swap cache, not including tmpfs (shmem), in bytes
- anonymous cache
- 先了解匿名映射: 进程使用 malloc 申请内存,或使用 mmap(MAP_ANONYMOUS 的方式)申请的内存
- 再了解文件映射: 进行使用 mmap 映射文件系统的文件,包括普通文件,也包括临时文件系统 (tmpfs), 另外 Sys v 的 IPC 和 POSIX 的 IPC 也是。
- swap cache
- Swap 机制: 当内存不够的时候,我们可以选择性的将一块磁盘、分区或者一个文件当成交换空间,将内存上一些临时用不到的数据放到交换空间上,以释放内存资源给急用的进程。
- Inactive(anon 匿名映射), 这部分内存能被交换出去的。 需要注意的是,内核也将共享内存作为计数统计进了 Inactive(anon)中去了(是的,共享内存也可以被 Swap)。
active_file + inactive_file = cache - size of tmpfs

active_anon + inactive_anon = anonymous memory + file cache for tmpfs + swap cache
按照两个维度来划分内存
- whether memory is private ( specific to that process ) or shared
- private
- shared
- whether the memory is file-backed or not (in which case it is said the be anonymous )
- anonymous: purely in RAM
- file-backed: When a memory map is file-backed, the data is loaded from disk
见下表:
| PRIVATE | SHARED | |
|---|---|---|
| ANONYMOUS | stack, malloc(), mmap(ANON, PRIVATE), brk()/sbrk() |
mmap(ANON, SHARED) |
| FILE-BACKED | nmap(fd, PRIVATE) binary/shared libraries |
mmapn(fd, SHARED) |
采坑记 - go 服务内存暴涨 , 对 MADV_FREE 结合页表来分析,更加详细
内存分配
- 在 Linux 下,malloc 需要在其管理的内存不够用时,调用 brk 或 mmap 系统调用 ( syscall ) 找内核扩充其可用地址空间
- OS 用页表来管理进程的地址空间,其中记录了页的状态、对应的物理页地址等信息,一页通常是 4kb
- 当进程读 / 写尚未分配的页面时,会出发一个缺页中断 ( page fault ), 这时内核才会分配页面,在页表中标记为已分配,然后再恢复进程的执行。
内存回收
- 当 free 觉得有必要的时候,会调用 sbrk 或 munmap 缩小地址空间,这是针对一整段地址空间都空出来的情况
- 但更多的时候只释放其中一部分内容(比如连续的 ABCDE 五个页面中只释放 C 和 D), 并不需要(也不能)把地址空间缩小
- free 可以通过 madvise 告诉内存”这一段我不用了"
madvise
- 通过 madvise(addr, length, advise) 这个系统调用,告诉内核可以如何处理从 addr 开始的 length 字节。
- 在 Linux Kernel 4.5 之前, 只支持 MADV_DONTNEED,内核会在进程的页表中将页标记为"未分配”, 从而进程的 RSS 就会变小。
go 1.12 的改进
- 从 kernel 4.5 开始,Linux 支持了 MADV_FREE.
threadcreate
goroutine
block
mutex
实践 web 方式 Mutex profle
里面提到的 PPT 在本地分析不出数据,, 因为没有用 goroutine
for _, f := range factors(n) {
  mu.Lock()
  m[f]++
  mu.Unlock()
}
mu.Lock()
for _, f := range factors(n) {
  m[f]++
}
mu.Unlock()
Trace
Synchronization blocking profile
来自 rhys Hiltner 分析。
the thing that we are spending here is seconds that we’re spent waiting. we have kind of the goroutine name at the top of the stack.
关于方框中"of"前面的的 0, 表示 “zero time was spent inside of the box of 4.43. 来自 Profiling and Optimizing Go, 关于 Type:CPU 的图解,时间: 11:00
goroutines
goroutines that were running in that propram during those few seconds that i was recoording and listed.
根据 Execution time\Network wait time\Sync block time\Blocking syscall time\Sechedule wait time 的情况后,可以通过 graph 图了解 goroutine 详细情况。参考 [10]
Flame
pprof -http "localhost:12345" 'http://127.0.0.1:53668/block?id=19105152&raw=1'
查看 goroutine 中执行时间。
在参考 [7] 的视频 11:43 开始实际操作使用 Flame 定位程序执行慢的问题。
Debugging
Runtime statistics and events
实践
定位高延迟的服务。
使用 logrus 打印日志文件,其中 Logrus 使用全局锁导致,goroutine 之间竞争写锁。
func (entry *Entry) write() {
	entry.Logger.mu.Lock()
	defer entry.Logger.mu.Unlock()
	serialized, err := entry.Logger.Formatter.Format(entry)
	if err != nil {
		fmt.Fprintf(os.Stderr, "Failed to obtain reader, %v\n", err)
	} else {
		_, err = entry.Logger.Out.Write(serialized)
		if err != nil {
			fmt.Fprintf(os.Stderr, "Failed to write to log, %v\n", err)
		}
	}
}
在这篇 Is there a golang logging library around that doesn’t lock the calling goroutine for logging? 链接里也提到 logrus 写锁怎么处理
- 协程异步写日志,但是会占内存
- 换 zap 库
其实并没有解答为什么延迟非常高的问题。
TODO
docker cgroup 技术之 memory 看起来挺详细的分析文档,待细看。
Go语言使用cgo时的内存管理笔记, 简单教你如何定位cgo导致的内存泄漏
cgo内存分析 进阶版, 三部曲,英文.
Rakyll 一系列的调优
参考
-
go tool proof 郝琳的中文说明 #TODO https://github.com/hyper0x/go_command_tutorial/blob/master/0.12.md
-
Profiling Go Programs 官方 Blog #TODO https://blog.golang.org/pprof
-
一次 Golang 程序内存泄漏分析之旅 http://lday.me/2017/09/02/0012_a_memory_leak_detection_procedure/ 链接访问有点问题,可以用 google cache 查看文字
-
一次 Golang 程序延迟过大问题的定位过程 http://lday.me/2017/09/13/0013_a_latency_identification_procedure/
-
go tool trace https://making.pusher.com/go-tool-trace/ #TODO
-
Go 程序的性能监控与分析 pprof https://www.cnblogs.com/sunsky303/p/11058808.html
-
Rhys Hiltner - An Introduction to “go tool trace” https://www.youtube.com/watch?v=V74JnrGTwKA
-
关于 Go 程序调式、分析和优化 来自 Brad Fitzpatrick 的分享 #TODO https://studygolang.com/articles/4716
-
Golang remote profiling and flamegraphs, 对各种图阐述的比较清晰 https://matoski.com/article/golang-profiling-flamegraphs/
-
Using Go 1.10 new trace features to debug an integration test, 这边文章描述了 trace 使用过程,赞 https://medium.com/@cep21/using-go-1-10-new-trace-features-to-debug-an-integration-test-1dc39e4e812d
-
Profiling Go programs with pprof #TODO https://jvns.ca/blog/2017/09/24/profiling-go-with-pprof/
-
rakyll blog #TODO https://rakyll.org/archive/
-
Diagnostics 官文 #TODO https://golang.org/doc/diagnostics.html
-
实战 Go 内存泄漏 https://segmentfault.com/a/1190000019222661
4 - Gorm
TIME_WATI 数量达到 300 多个, 连接中的数量只有几个。
设置
设置下最大连接数(100)和闲置连接数(50)以及连接的时间(1 小时)
从 [2] 文章测评来看,unlimited ConnMaxLifetime 的情况下,时间和内存分配上都会少。 该 ConnMaxLifetime 使用场景如:
你的 SQL 数据库实现了最大的连接生存期, 或你希望在负载均衡器后面方便的切换数据库 (这句话不是很懂)
SetMaxIdleConns 设置
维护一个大的空闲连接池,副作用是有的,占用内存。另外一种可能是,如果一个连接空闲太久,那么它也可能变得不可用。例如 Mysql 的 wait_timeout 设置将自动关闭 8 小时内未使用的任何连接(默认情况下), 当发生这种情况时,sql.DB 会优雅的处理它。 在放弃之前,将自动重试两次连接,之后 Go 将从池中删除坏连接并创建新连接。
超出连接限制
如果数据连接限制为 5 个,一旦达到 5 个连接的硬限制,pg 数据库驱动程序立即返回一条 sorry, too many clients already 错误信息, 而不是完成插入操作。
参考
-
分析 golang sql 连接池大量的 time wait 问题 http://xiaorui.cc/archives/5771
-
配置 sql.DB 获得更好的性能 https://colobu.com/2019/05/27/configuring-sql-DB-for-better-performance/
5 - Golang语言之禅
理解
Each package fulfils a single purpose 保持每个package的单一目的性
A well designed Go package provides a single idea, a set of related behaviours. A good Go package starts by choosing a good name. Think of your package’s name as an elevator pitch to describe what it provides, using just one word.
Handle errors explicitly 显式处理errors
Robust programs are composed from pieces that handle the failure cases before they pat themselves on the back.
The verbosity of if err != nil { return err } is outweighed by the value of deliberately handling each failure condition at the point at which they occur.
Panic and recover are not exceptions, they aren’t intended to be used that way.
Return early rather than nesting deeply 提前返回胜过深嵌套
Every time you indent you add another precondition to the programmer’s stack consuming one of the 7 ±2 slots in their short term memory. Avoid control flow that requires deep indentation. Rather than nesting deeply, keep the success path to the left using guard clauses.
Leave concurrency to the caller 把并发交给调用者
Let the caller choose if they want to run your library or function asynchronously, don’t force it on them. If your library uses concurrency it should do so transparently.
Before you launch a goroutine, know when it will stop 使用goroutine之前想清楚它什么时候结束
Goroutines own resources; locks, variables, memory, etc. The sure fire way to free those resources is to stop the owning goroutine.
Avoid package level state
Seek to be explicit, reduce coupling, and spooky action at a distance by providing the dependencies a type needs as fields on that type rather than using package variables.
Simplicity matters
Simplicity is not a synonym for unsophisticated. Simple doesn’t mean crude, it means readable and maintainable. When it is possible to choose, defer to the simpler solution.
Write tests to lock in the behaviour of your package’s API 编写单元测试,保证Package API行为
Test first or test later, if you shoot for 100% test coverage or are happy with less, regardless your package’s API is your contract with its users. Tests are the guarantees that those contracts are written in. Make sure you test for the behaviour that users can observe and rely on.
If you think it’s slow, first prove it with a benchmark
So many crimes against maintainability are committed in the name of performance. Optimisation tears down abstractions, exposes internals, and couples tightly. If you’re choosing to shoulder that cost, ensure it is done for good reason.
Moderation is a virtue
Use goroutines, channels, locks, interfaces, embedding, in moderation.
thress attribute of Channel
- Gurarantee Of Delivery
- Ticker的实现为什么使用Delayed Guarantee类型的Channel
- Ticker为什么会丢失
- State
- With or Without Data
Maintainability counts 可维护性
Clarity, readability, simplicity, are all aspects of maintainability. Can the thing you worked hard to build be maintained after you’re gone? What can you do today to make it easier for those that come after you?
翻译原文: https://github.com/davecheney/the-zen-of-go
参考
-
The Behavior Of Channels #TODO https://www.ardanlabs.com/blog/2017/10/the-behavior-of-channels.html
-
Go proverbs https://www.kancloud.cn/cserli/golang/524388
6 - Code Review 开始
简介
整个golang团队20多人,没有code review ,对项目质量、对结果产出、对新人的成长,对团队交流的氛围影响大。 看过Google 代码评审规范,解决了我之前一些疑问和也让我坚定的去Code Review。
当没有code review时候,要求重构,而重构价值是释放历史包袱,并没有产生任何其他价值
- 我们的提交是这样的
3b8e45c - Slove Confilct -  2 weeks ago -
0a39ecd - FIXS: vendor -  2 weeks ago -
7817d14 - debug -  2 weeks ago -
67539e2 - debug -  2 weeks ago -
9044356 - Slove Confilct -  2 weeks ago -
d47db91 - FIXS: ss -  2 weeks ago -
8913c30 - Slove Confilct -  2 weeks ago -
2d407d2 - FIXS: logger -  2 weeks ago -
b9af055 - 打印日志 -  7 weeks ago -
1124e92 - 打印日志 -  7 weeks ago -
88d0eac - 修改log -  7 weeks ago -
ad0b3dd - 修改日志 -  7 weeks ago -
4aa0740 - 答应日志 -  7 weeks ago -
824658a - 修改日志 -  7 weeks ago -
178c30c - 打印日志 -  7 weeks ago -
在pull request的时候,认真review下所有的commit,该合并得合并,该修改得修改
-
我们的命名是这样的
这里不截图纪念了. -
我们的代码分支和发版是这样的
本地打包,更恶心的是代码不提交本地打包的. -
我们的单元测试是这样的
几乎没有
我们开始要做Code Review, 从哪里开始了?
方式
谁对谁在什么时候用什么方式去做什么?
第一个“谁”
代码评审员
如果项目存在两人或者两人以上开发
- 如果开发提交代码,则应用项目负责人
- 如果应用负责人也参与开发,则由另外任一一位开发做一次review,然后上一级的负责人做第二次review。
如果应用负责人和开发是同一个人,这时候为“小组Leader”
自动Lint工具
借助自动化完成代码最基本的审核, 比如reviewdog & golangci-lint, 更多相关知识Github Action-golangci-lint
第二个“谁”
业务开发人员对应用提交的pull request
什么时候
提交Review时的当天或者第二天须完成
什么方式
依照代码审核规范, 目前缺少自己的审核规范, 类似规范参考
- 代码审查规范
- 代码规范[golang]
- How Thanos Would Program in Go
- 参考runutil包解决defer中error的检查问题, 相比写匿名函数更加的优雅
- 包
pkg/errors比标准的fmt.Errorf+%w更可读 - 待补充
- How Thanos Would Program in Go
做什么
阅读提交的代码并给出建议完成审核
落地
reviewdog & golangci-lint在gitlab上配置实践
熟悉github action方式, 借鉴其优点; 在一个项目中实践,然后推广到其他项目中。
- 如何做到所有项目不需要自行配置或者简单的配置(比如增加一个配置现成的文件),并且使用同一个套代码检查标准?
制作包含reviewdog.yml的配置文件,如果做linter升级的话,更新tag为latest最新的镜像即可., 已经完成了在一半的项目上增加reviewdog- 目前linter设置为golint和errcheck方式, 下一步增加golangci-lint检查代码
- 目前没有非常成熟的方案,需要花费一些时间去解决现有开源方案中的问题。
- reviewdog 结合 golangci-lint 使用,修改其输出格式, more link 在presto-pay是使用golangci-lint,但是reviewdog在官网上没有golangci-lint的案例
失败
- golangci-lint自身大而全的能力,导致其功能本身不稳定,不如golint或errcheck那么纯粹
reviewdog & golint/errcheck/govet/… 在 gitlab 上配置实践
reviewdog:
  stage: review
  # 自定义镜像, 包含统一的reviewdog配置文件和需要安装的reviewdog/golangci-lint版本
  image: golang:custom-latest
  before_script:
    - curl -sfL https://raw.githubusercontent.com/reviewdog/reviewdog/master/install.sh| sh -s -- -b $(go env GOPATH)/bin v0.10.0
    - curl -sSfL https://raw.githubusercontent.com/golangci/golangci-lint/master/install.sh | sh -s -- -b $(go env GOPATH)/bin v1.27.0
    - export GITLAB_API="https://examplegitlab.com/api/v4"
  script:
    - reviewdog -conf=/etc/reviewdog/reviewdog.yml  -reporter=gitlab-mr-discussion  -guess -fail-on-error=true
  only:
    - merge_requests
reviewdog.yml 配置如下
runner:
  golangci:
    cmd: golangci-lint run --config=/etc/reviewdog/golangci/golangci.yml ./...
    errorformat:
      - '%E%f:%l:%c: %m'
      - '%E%f:%l: %m'
      - '%C%.%#'
    level: warning
更多:
- reviewdog 结合各种错误检查,详细见: reviewdog.yml
- 使用预设的errformat, 例如通过参数
-f=golangci-lint,更多的预设errformat使用reviewdog -list查看, 点击链接 go.go - 在gitlab里配置参考gitlab上的工程:reviewdog test
- exit code的处理
- errcheck 命令在检查到 err 时,exit code为0 (通过echo $?查看, 更多查看Chapter 6. Exit and Exit Status)
- reviewdog默认的 exit code 为0, 当加上 -fail-on-error=true时候则会返回1(当检查到不规范的时候)
- errcheck | reviewdog 根据现象是当errcheck 的 exit code 为1时,job会失败。 解决办法是 ( errcheck 2>&1 || true ) | reviewdog
在这个过程中,不断增加的检查机制, 并说明理由\目的
thanos 代码规范推荐的代码 linter 工具 go vet, 同时也推荐 golangci-lint,
但 golangci-lint 无法配置的原因, 将考虑一个个配置其默认的 linter , 建议参考Thanos 里配置的 linters
- govet
- errcheck
- staticcheck
- unused
- gosimple
- structcheck
- varcheck
- ineffassign
- deadcode
- typecheck
golint
errcheck
go vet
TODO
反复阅读代码评审规范. 不断增加或修正 linter
参考
-
golangci-lint https://github.com/golangci/golangci-lint
7 - Gomonkey Test
简述
项目中重视单元测试,选择使用简单的第三库来实现 mock,是至关重要的,有太多的方法、依赖、全局变量需要 Mock。
各领风骚
gomonkey
gomonkey is a library to make monkey patching in unit tests easy
gomonkey should work on any amd64 system
…
只取一瓢
- Tsung is an open-source distributed load testing tool that makes it easy to stress test websockets (as well as many other protocols.), 比如对 Websocket 长连接的压测[3]
参考
时机落后的 Intel 开始支持 AMD64 的指令集, 但是换了名字,叫x84_64, 表示x86指令集的64扩展
x86_64, x64, AMD64 基本上是同一个东西
[2] [gomonkey 博主简书] (https://www.jianshu.com/u/1381dc29fed9) golang开发
[3] Gary Rennie: The Road to 2 Million Websocket Connections in Phoenix.
[4] eranyanay: Going Infinite, handling 1M websockets connections in Go
8 - Daily 0131 Golang 杂乱
golang, 还是学习吧
已经两个月没有更新了
guru for vim-go #TODO
Using Go Guru 详细介绍了 guru 功能点
vim go tutorial#guru 看到对 scope 的介绍,简单易懂的教程。
Pointer analysis scope: some queries involve pointer analysis, a technique for answering questions of the form “what might this pointer point to?”.
vim-go automatically tries to be smaart and sets the current packages import path as the scope for you.
go stack
了解 golang runtime 的堆栈信息,学习如何查看 golang stack trace
- 堆栈跟踪,堆栈的参数
- 变量是在堆 ( heap ) 还是堆栈 ( stack ) 上
go list
如何列出依赖的外部 package List external dependencies of package
go list -f '{{join .Deps "\n"}}' | xargs go list -f '{{if not .Standard}}{{.ImportPath}}{{end}}'
或者使用 deplist
go modules 410 Gone
原因: 由于你的 go 库声明为 go1.12 格式,此时将没有 SUMDB 校验信息,因而在一个 go1.13 项目中引用这样的旧的库格式会产生校验错误,进而报错为 410 Gone。
解决办法:
- 对于使旧格式库的人来说, 以下方式帮你顺利下载库和完成引用。
export GONOSUMDB="github.com/hedzr/errors,$GONOSUMDB"
## OR

export GOSUMDB=off
- 对于该库的拥有者而言,下面的办法是正确的处理方案,在 go.mod 中修改库宣告的版本格式为 1.13. 例如:
module github.com/hedzr/errors

go 1.13  // go 1.12
package main
import (
  "encoding/json"
  "net/http"
)
type Profile struct {
  Name    string
  Hobbies []string
}
func main() {
  http.HandleFunc("/", foo)
  http.ListenAndServe(":3000", nil)
}
func foo(w http.ResponseWriter, r *http.Request) {
  profile := Profile{"Alex", []string{"snowboarding", "programming"}}
  js, err := json.Marshal(profile)
  if err != nil {
    http.Error(w, err.Error(), http.StatusInternalServerError)
    return
  }
  w.Header().Set("Content-Type", "application/json")
  w.Write(js)
}
先来段 go 代码,上面代码是返回 JSON 数据,是不是郁闷,为什么还要定义 struct Profile,没有 python/js/ 等等灵活呀
再看下 GO 怎么读 JSON 数据的
package main

import (
	"encoding/json"
	"fmt"
	"net/http"
)

type test_struct struct {
	Test string
}

func parseGhPost(rw http.ResponseWriter, request *http.Request) {
	decoder := json.NewDecoder(request.Body)

	var t test_struct
	err := decoder.Decode(&t)

	if err != nil {
		panic(err)
	}

	fmt.Println(t.Test)
}

func main() {
	http.HandleFunc("/", parseGhPost)
	http.ListenAndServe(":8080", nil)
}
*** curl -X POST -d “{"test": "that"}” http://localhost:8080 *** 测试
Bolt是 GO 语言 key/value 存储数据库,
The API will be small and only focus on getting values and setting values. That’s it.
Bolt is currently used in high-load production environments serving databases as large as 1TB. Many companies such as Shopify and Heroku use Bolt-backed services every day.
db.Update(func(tx *bolt.Tx) error {
	b := tx.Bucket([]byte("MyBucket"))
	err := b.Put([]byte("answer"), []byte("42"))
	return err
})
更新数据库 是不是写起来很费劲呀!
db.View(func(tx *bolt.Tx) error {
	b := tx.Bucket([]byte("MyBucket"))
	v := b.Get([]byte("answer"))
	fmt.Printf("The answer is: %s\n", v)
	return nil
})
读数据一样,就不能直接 SET/GET 吗?
用 Go 自带的 http 参考这个文章 How to use sessions in Go 写了 session 机制
技术选型:如何选择一个合适的 Go http routing 呢? 那这篇文章告诉你答案:go http routing benchmark
This benchmark suite aims to compare the performance of HTTP request routers for Go by implementing the routing structure of some real world APIs. Some of the APIs are slightly adapted, since they can not be implemented 1:1 in some of the routers.
再 tornado 中异步无阻塞的执行耗时任务 原理得看,run_on_executor 装饰器对传递进来的函数封装,用 io_loop. TODO
罗列 GO 资源:
Go perfbook Writing and Optimizing Go code
Go 中文资料 杂乱,须整理成自己的知识网
fasthttp 这个性能,相比 GO 自带的 http,相差很远
ruby 点点滴滴,奇奇怪怪
[Ruby 中的 @ % # $ 等各种千奇百怪的符号的含义等』 (http://www.cnblogs.com/likeyu/archive/2012/02/22/2363912.html) @开始是实例变量、@@开始的变量是类变量 $ 开始的变量是全局变量,在程序的任何地方都可以引用。
- 若左边最后一个表达式前带号的话,将右边多余的元素以数组的形式代入这个带的表达式中。若右边没有多余元素的话,就把空数组代入其中
?! 两个符号,一个表示布尔值,另外一个表示需要注意的
参考
-
go modules 410 Gone https://juejin.im/post/5e0ec5d75188253aa20e858e
-
Go Modules with Private Git Repositories https://medium.com/cloud-native-the-gathering/go-modules-with-private-git-repositories-dfe795068db4